Accessing the Project Dashboard
- Open the project from the Projects list
- View the main chart for an overview of project metrics
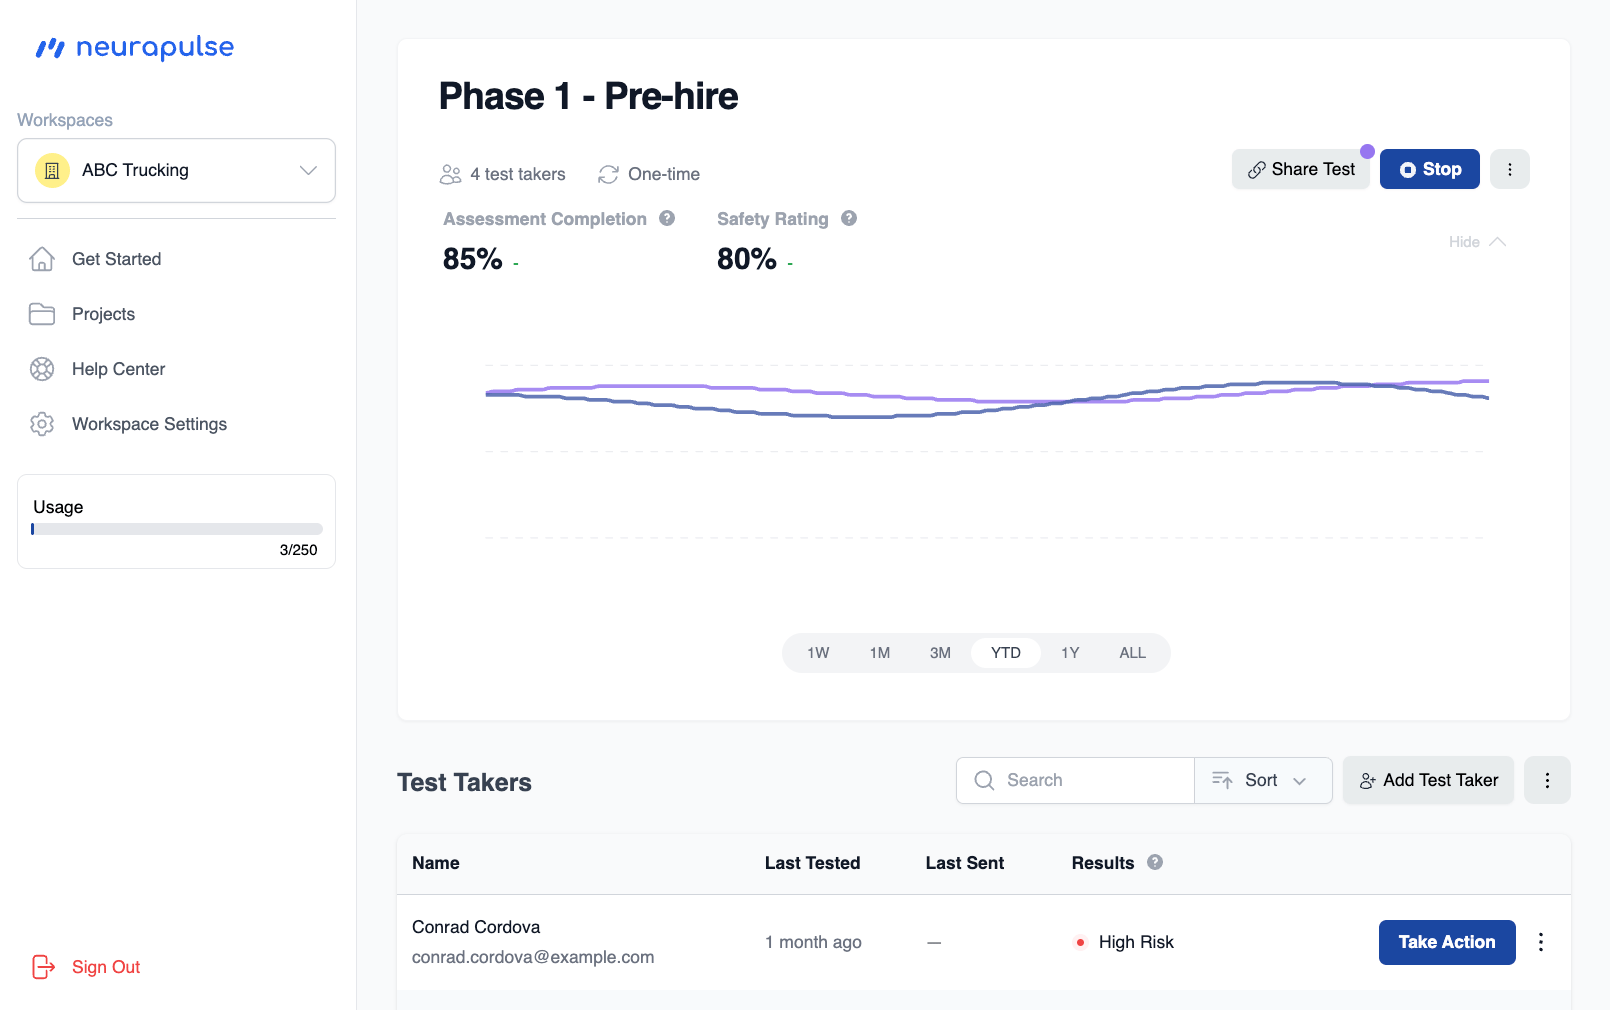
Key Metrics
- Safety Rating - The average percentage of completed assessments classified as safe over the selected period. The change shows how this average compares to the previous equivalent period.
For a 7-day period: If the average Safety Rating for the past 7 days is 85%
and it was 80% for the 7 days before that, the change would be shown as “+5%
from previous week”.
- Test Completion Rate - The average percentage of started assessments that were completed over the selected period. The change indicates how this average compares to the previous equivalent period.
For a 7-day period: If the average Assessment Completion rate for the past 7
days is 90% and it was 95% for the 7 days before that, the change would be
shown as “-5% from previous week”.
Analyzing Trends
- Click on the Hide/Show button on the chart to expand/collapse
- Hover over data points for detailed information
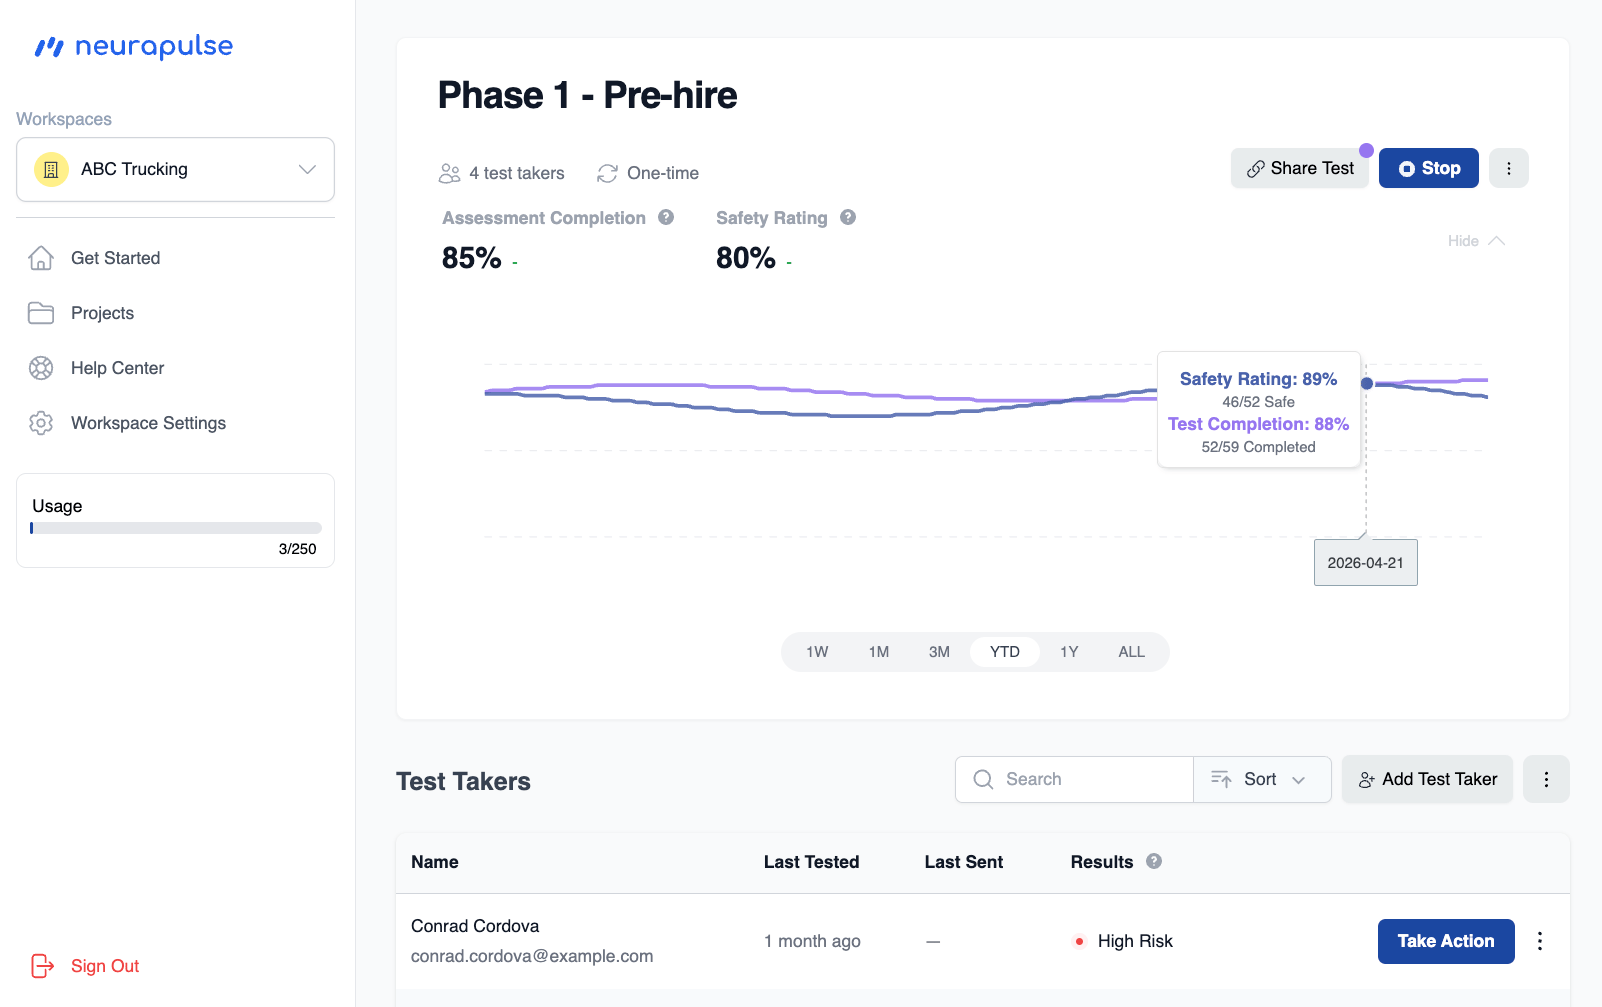
- Monitor changes in safety ratings over time
- Identify patterns or shifts in risk levels
Using Data for Decision Making
- Implement targeted safety measures based on trends
- Increase testing frequency if needed
- Use insights to inform training programs or policy updates
Regularly review project-level data to identify long-term trends and optimize
your safety protocols. This is especially powerful with projects containing
many test takers.